2023. 2. 10. 23:44ㆍ🧡 Programming/💻 Python

매번 Matplotlib으로 이미지를 플롯하다보면 이미지 여러장 들을 동시에 플롯하고 싶은 경우가 있다.
나도 매번 항상 헷갈려서 찾아보는데 이번 기회에 좀 정리하려고 포스팅을 한다.
matplotlib.pyplot 모듈의 subplot() 함수는 여러개의 그래프, 이미지를 하나의 그림에 나타내도록 한다.
나는 다음과 같이 import 한 후 사용하였다.
import os
import skimage
import IPython.display
from PIL import Image
import numpy as np
import cv2
import matplotlib
import matplotlib.pyplot as plt
from matplotlib.gridspec import GridSpec
그리드,칸 나누는 법
먼저 간단한 예시를 보자.
open ai의 github에서 제공하는 파일을 하나 가져왔다.
이미지 플롯이 깔끔하게 구성되어 있어서 기본적인 틀을 잡는데 도움이 될 것 같았다.
그리고 for문으로 구성되어있어서 코드를 좀 더 편하게 작성 할 수 있다.
subplot(nrows, ncols, index, **kwargs)subplot을 사용 할 때, 가장 먼저 따져야 하는 것은 이미지를 어떻게 배치할 것인가이다.
subplot을 처음 불러 줄 때 (세로로 몇 줄(rows), 가로로 몇 줄(cols), index)를 지정해야 사용 가능하다.
original_images = []
images = []
texts = []
plt.figure(figsize=(16, 5))

for filename in [filename for filename in os.listdir(skimage.data_dir) if filename.endswith(".png") or filename.endswith(".jpg")]:
    name = os.path.splitext(filename)[0]
    if name not in descriptions:
        continue

    image = Image.open(os.path.join(skimage.data_dir, filename)).convert("RGB")

    plt.subplot(2, 4, len(images) + 1)
    plt.imshow(image)
    plt.title(f"{filename}\n{descriptions[name]}")
    plt.xticks([])
    plt.yticks([])

    original_images.append(image)
    images.append(preprocess(image))
    texts.append(descriptions[name])

plt.tight_layout()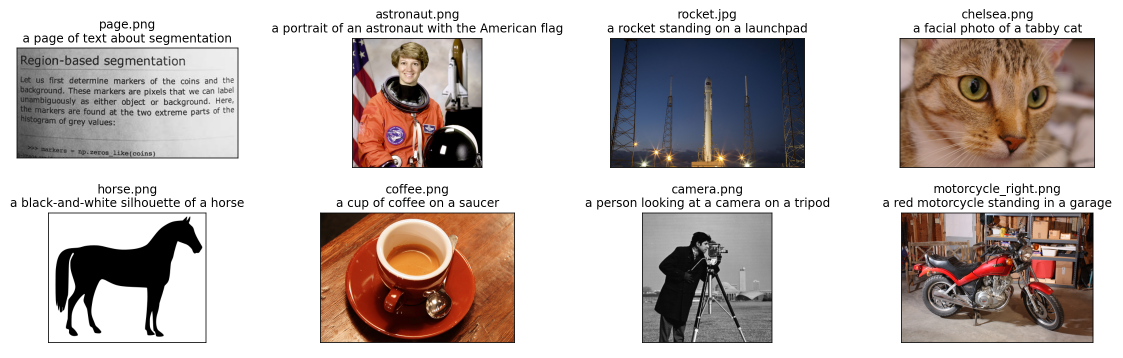
먼저 plt.subplot(2,4,n) 부분을 보면 칸을 세로로는 2칸, 가로로는 4칸을 나눈 다는 것을 알 수 있다.
그리고 n번째에 이미지를 넣는 코드이다.
이 방법이 아니라 다른 방법도 가능하다.
for문으로 이미지를 플롯하기 어려운 경우에는 플롯 인덱스마다 하나 하나 이미지를 지정 해 주는 방법도 있다.
이런 방식을 택하면 이미지 하나 하나 마다 디테일한 설정을 할 수 있다는 것이 장점이다
# 1
fig,axs = plt.subplots(1,2,figsize=(4,2))
axs[0].imshow(images[0])
axs[1].imshow(images[1])

#2
ax1 = plt.subplot(2, 1, 1)
plt.imshow(images[0])
plt.ylabel(image_list[0])
plt.xticks(visible=False)

ax2 = plt.subplot(2, 1, 2, sharex=ax1)
plt.imshow(images[1])
plt.xlabel('image samples')
plt.ylabel(image_list[1])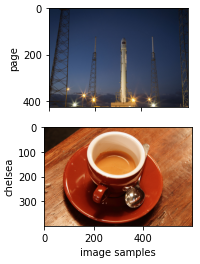
그리드,칸 합치는 법
그런데 !!
아주 가끔 칸을 좀 내 마음대로 조정하고 싶은 경우가 생긴다.
한 이미지를 여러가지 방법으로 변화시켰을때 좀 한 눈에 보기 쉽게 플롯하기 쉬운 방법이 없을까 고민하다가 알게 된 방법이다.
이런 경우에는 matplotlib.gridspec.GridSpec을 사용하면 된다.
먼저 GridSpec으로 칸 수를 지정해 준다.
class matplotlib.gridspec.GridSpec
(nrows, ncols, figure=None, left=None, bottom=None, right=None,
top=None, wspace=None, hspace=None, width_ratios=None, height_ratios=None)
그리고 합치고자 하는 행,열 번호를 GridSpec의 행열을 이용하여 합치면 된다.
그리고 나머지 이미지들은 원하는 위치에 GridSpec을 이용하여 지정하면 된다.
fig_img = plt.figure(figsize=(8,5))
gs = GridSpec(ncols = 5, nrows = 2,figure = fig_img)

fig_img.suptitle('Image format by GridSpec')

ax0 = fig_img.add_subplot(gs[:,0])
ax0.title.set_text('Main Image')
ax0.imshow(images[0], interpolation = 'none')


for i in range(2):
  for j in range(4):
    ax = fig_img.add_subplot(gs[i,j+1])
    ax.imshow(images[(i*1)+j])
    ax.title.set_text(image_list[(i*1)+j])
    ax.axis('off')

fig_img.tight_layout()
plt.show()
plt.close()
조금 더 무식한 방법도 있다.
for 문을 사용할 수 없을 때는 다음 더보기와 같이 번거롭게 사용하자..
fig_img = plt.figure(figsize=(8,5))
gs = GridSpec(ncols = 5, nrows = 2,figure = fig_img)

fig_img.suptitle('Image format by GridSpec')

ax0 = fig_img.add_subplot(gs[:,0])
ax0.title.set_text('Main Image')
ax0.imshow(images[0], interpolation = 'none')

ax1 = fig_img.add_subplot(gs[0,1])
ax2 = fig_img.add_subplot(gs[0,2])
ax3 = fig_img.add_subplot(gs[0,3])
ax4 = fig_img.add_subplot(gs[0,4])
ax5 = fig_img.add_subplot(gs[1,1])
ax6 = fig_img.add_subplot(gs[1,2])
ax7 = fig_img.add_subplot(gs[1,3])
ax8 = fig_img.add_subplot(gs[1,4])

ax1.axis('off');ax2.axis('off');ax3.axis('off');ax4.axis('off')
ax5.axis('off');ax6.axis('off');ax7.axis('off');ax8.axis('off')

ax1.title.set_text(image_list[1])
ax1.imshow(images[1])
ax2.title.set_text(image_list[2])
ax2.imshow(images[2])
ax3.title.set_text(image_list[3])
ax3.imshow(images[3])
ax4.title.set_text(image_list[4])
ax4.imshow(images[4])

ax5.title.set_text(image_list[5])
ax5.imshow(images[5])
ax6.title.set_text(image_list[6])
ax6.imshow(images[6])
ax7.title.set_text(image_list[7])
ax7.imshow(images[7])
ax8.title.set_text(image_list[0])
ax8.imshow(images[0])

fig_img.tight_layout()
plt.show()
plt.close()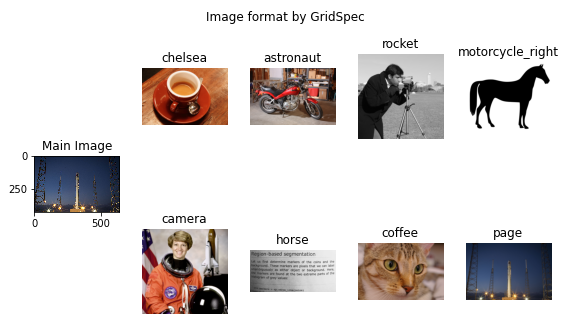
예시 이미지는 위에랑 같은 이미지를 가져다 사용했지만 실제로 실험을 정리할 때는 유용하다....
다들 유용하게 사용하시길 !
출처
[1]https://matplotlib.org/stable/tutorials/intermediate/constrainedlayout_guide.html#sphx-glr-tutorials-intermediate-constrainedlayout-guide-pyps://codetorial.net/matplotlib/subplot.html
[3]https://matplotlib.org/stable/api/_as_gen/matplotlib.gridspec.GridSpec.html
'🧡 Programming > 💻 Python' 카테고리의 다른 글
| [OpenCV] 이미지 ROI 마스크 적용 방법들, 컬러 마스크 중복 적용 하기 (x연산, bitwise, copyTo, addWeighted) (0) | 2023.02.18 |
|---|---|
| [PyTorch] Custom Dataset 만들기 (0) | 2023.02.18 |